Map << Using BioFinder << Interpreting Results << Tips & Tricks << Creating BioFinder << VT Conservation Design
Tips & Tricks
map tips » layers menu » changing the theme » using multiple layers together» basemaps » quick tools » tabs in the toolbar » biofinder definitions
Open the BioFinder map tool by clicking this symbol:
Map Tips
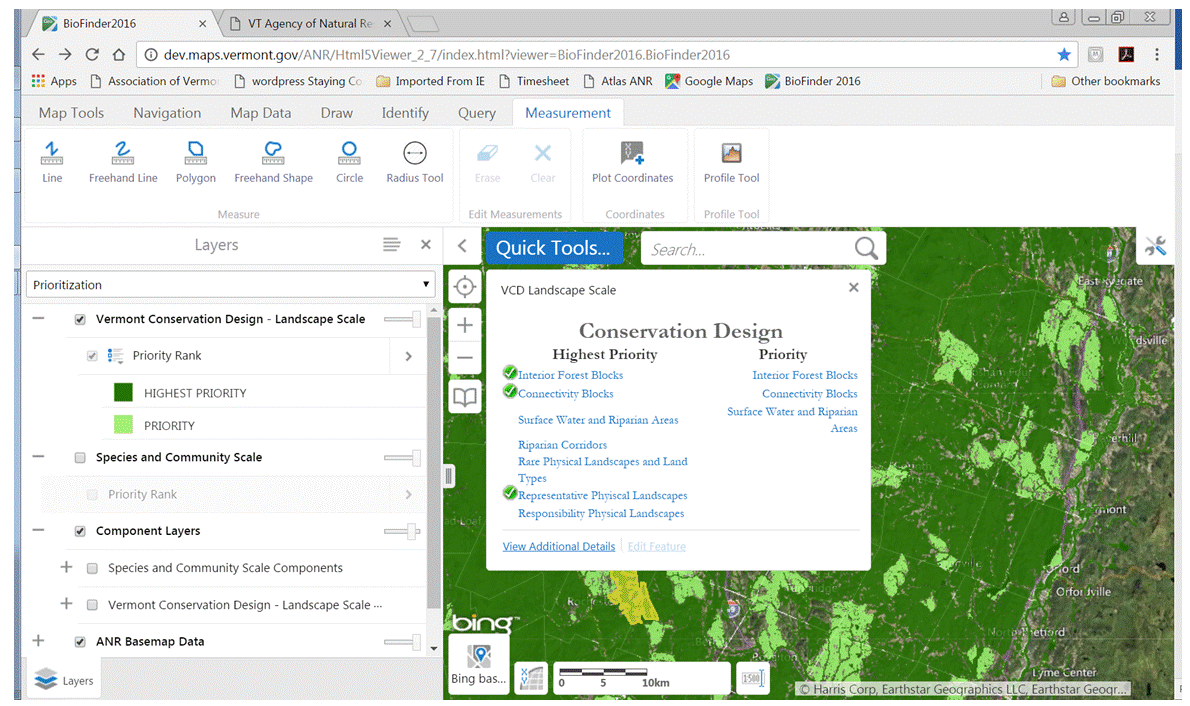
Perhaps the most useful tool in BioFinder is a simple left click of the mouse on any chosen location on the map. A box will then pop up with detailed information about all the layers checked "on" in the Layers menu that are present in the chosen location. When BioFinder first loads, only Vermont Conservation Design—the landscape scale priorities—are turned on. The results in the box therefore describe the components included as priorities for Vermont Conservation Design. Components present in the selected location are marked with a green check mark. No checkmark is present when the component has not been documented in the chosen location. In the example below, there are three VCD components present.
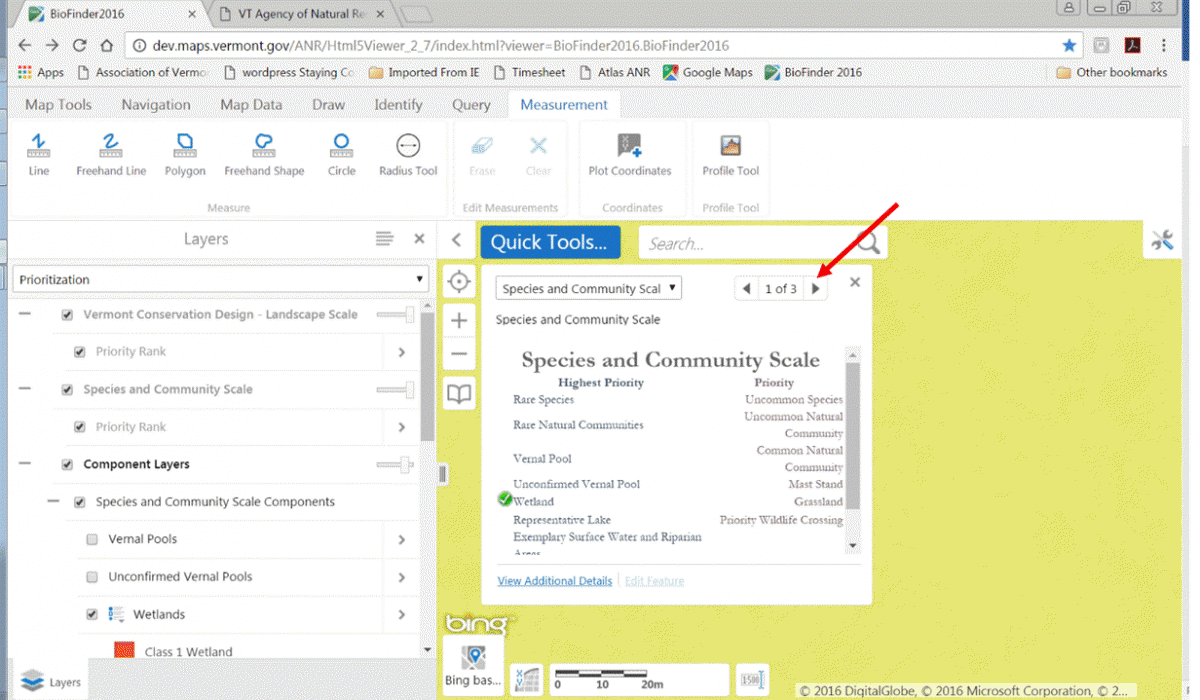
When multiple layers are turned on, the MapTips box creates a separate "page" of results for each layer present. In the example below, three layers are present in the location clicked. This is indicated by the "1 of 3" box with arrows in the top, right-hand corner of the box. Click on the arrows to move between pages of results.
For most layers you can click on View Additional Details on the MapTips page and more information about the layer will appear at left.
Layers Menu
Allows you to select which information to display on the map.
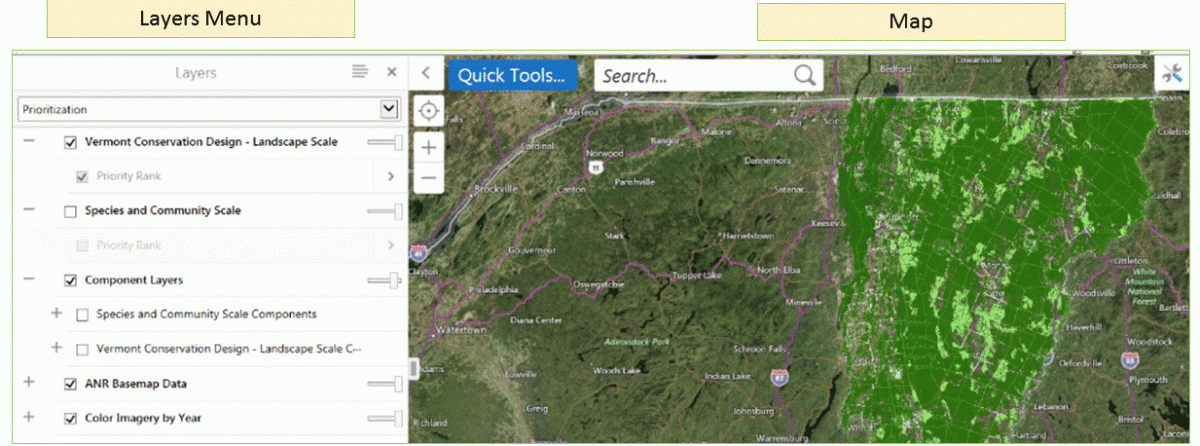 When BioFinder launches, your map will display on the right. On the left, the Layers menu lists all datas available for display.
 You can build a map to suit your needs by clicking the checkbox next to each layer name to turn that layer on or off. A "✔" will appear next to all layers displayed on the map.
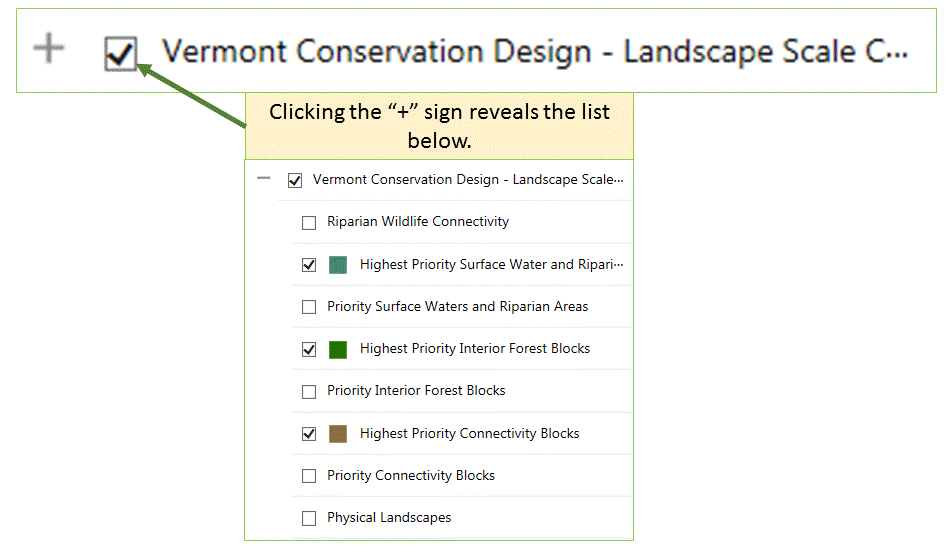 In some cases, several layers are listed together under a common heading. These headings display a "+" or "-" symbol to the left of the heading name. Clicking a "+" will display all associated layers; clicking a "-" will collapse the list to display only the heading name. The box next to the heading turns on or off all associated layers that have been checked.
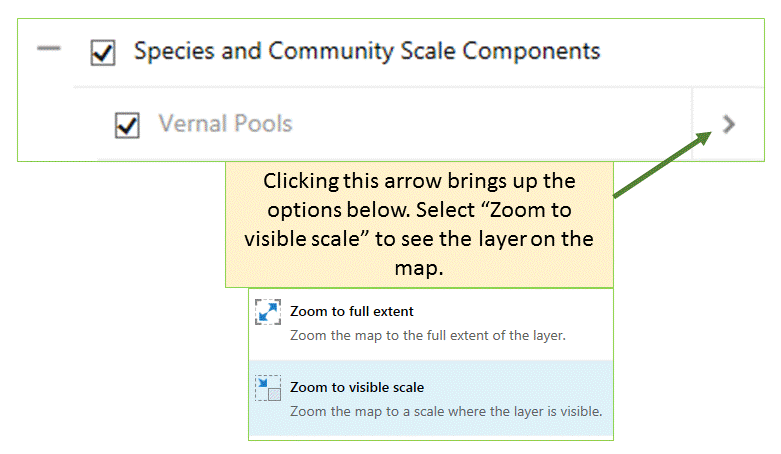 Layer names may appear "greyed out"—lighter in color—when the data can't be displayed at the current map scale. To see these layers, click on the right arrow next to a layer title and choose to "Zoom to visible scale."
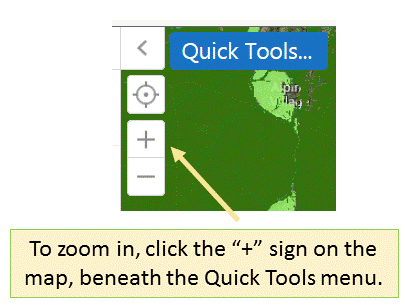
You can also zoom in using the zoom tool on the map.
Changing the Theme
Allows you to switch between raw inventory information and map layers already prioritized at the state level.
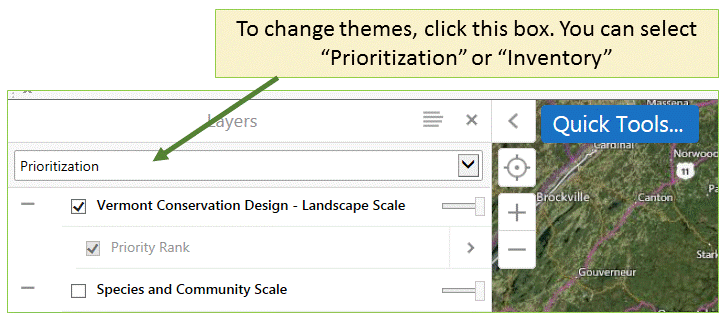
BioFinder categorizes all information into two "themes." Each theme includes a separate list of map information that can be displayed or turned off as desired. The default theme, entitled Prioritization, appears when you first open the map tool, but an Inventory theme is also available. Change the theme through the pulldown menu at the top, left corner of the screen, under the word "Layers."
Prioritization Theme
Helps you find and highlight the locations of highest ecological importance.
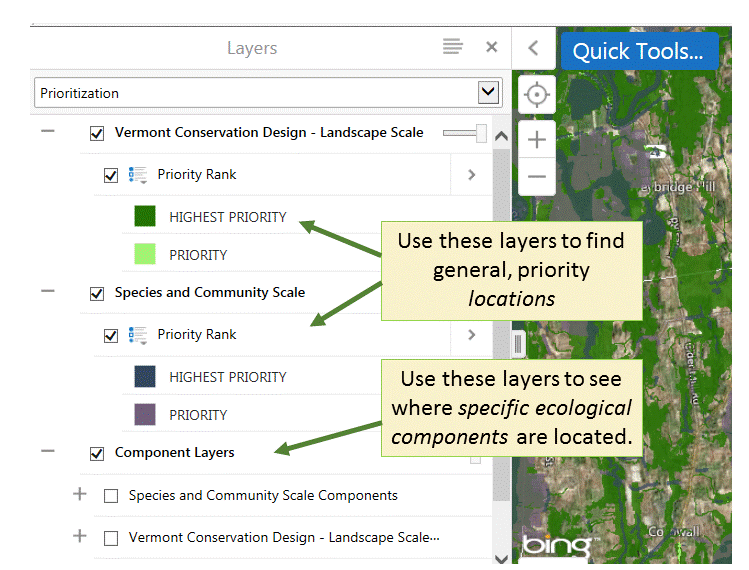
The "Prioritization" theme identifies ecological priorities based on their contribution to regional ecological function—the ability of habitats, plants and animals to interact as needed in order to thrive, reproduce, migrate, and move, even as the climate changes. This theme considers important components at two scales—the Landscape scale (large blocks of forest, water networks, etc.) and the "Species and Community" scale (individual wetlands, wildlife road crossings, vernal pools, etc.)
In the Layers menu, a user can use the top portion to identify general locations selected as highest priority, and priority areas by Vermont biologists. By exploring the bottom "Component Layers" section, the user can then look more closely at which components—forests, rare species, riparian areas, etc.—contribute to the priority ranking of different locations.
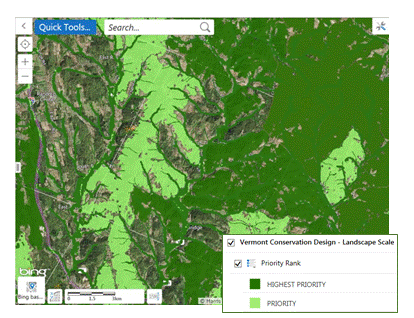
Landscape Scale priorities create the backdrop for interactions among the majority of Vermont's species. These priorities consider the forest networks, waterways, and physical landforms that provide habitat to countless Vermont species. In the first map layer, this information is displayed by lumping all landscape scale components together and categorizing Vermont into locations of highest priority, priority, and those that are not landscape priorities for the bulk of Vermont's species. Areas tagged as "highest priority" are those critical for maintaining an ecologically functional landscape. While areas labeled "priority" are also important, they play a lesser role in maintaining regional ecological function—though they may remain critical locally.
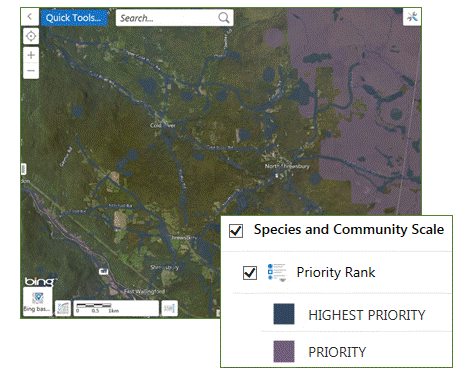
Species and Community Scalepriorities are important to individual species or groups of species of conservation concern within Vermont. These habitats tend to be smaller in size, but equally important for those species that use them. This layer includes habitat for rare species, vernal pools, locations where wildlife are most likely to cross roads, and more. VFWD biologists have also divided these important components into "highest priority" and "priority" groups.
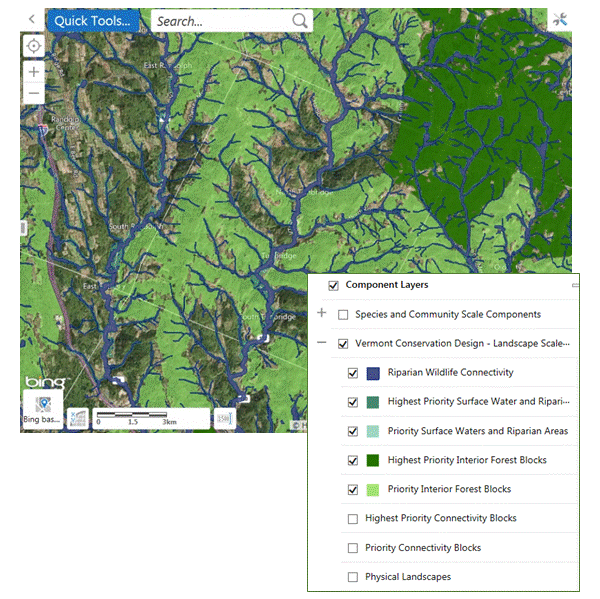
Component Layers: The 22 ecological components that create the priority layers above are listed individually in this section. Click the + next to "Species and Community Scale Components" or "Vermont Conservation Design—Landscape Scale Components" to see the full list of components used. Clicking on the box next to each layer will turn a component on and off, and together, this list will reveal why each location has been identified as a "highest priority" or "priority" area.
Please note that if either of the prioritization layers is turned on, those maps will display on top of component layers. To see component layers, be sure that the boxes next to Vermont Conservation Design—Landscape Scale and Species and Community Scale are not checked.
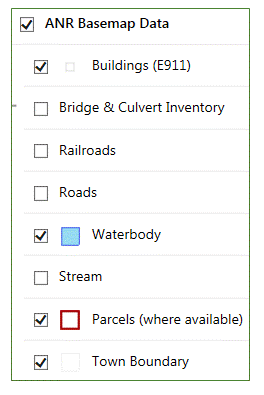
ANR Basemap Data: This set of layers provides additional information often used for navigation or for finding landmarks, such as roads, streams, rivers, and the locations of buildings and parcels.
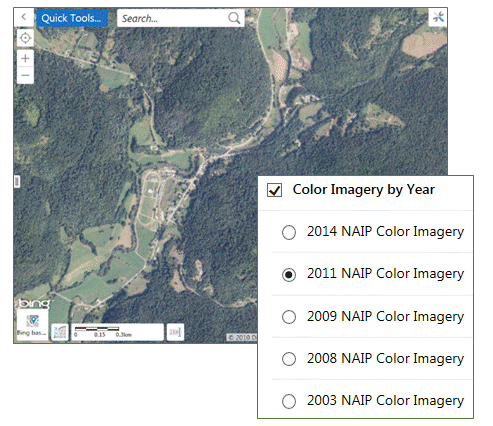
Color Imagery:These layers allow you to change the background to aerial photographs taken in different years—between 2003 and 2014—in order to see changes to the landscape during that time.
Inventory Theme
Answers the question: What's here?
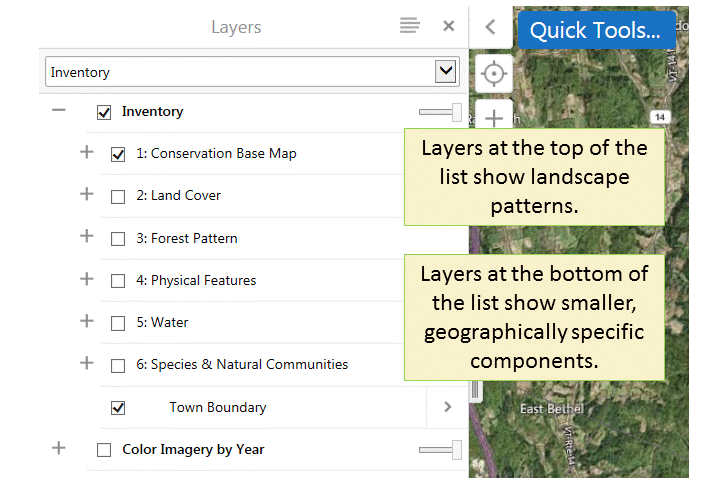
The "Inventory" theme presents basic information about the location of features often used in conservation planning. While information in the "Prioritization" theme was developed or chosen by VFWD biologists to represent the most importantecological locations and components for conservation planning, "Inventory" information has not been interpreted in any way. It represents the "raw data" upon which the state's prioritization efforts were based. This allows a user to explore the breadth of ecological components at play on a local or regional landscape.
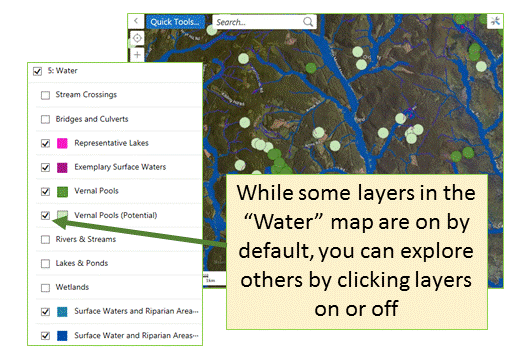
Information in this theme is displayed as a series of already-compiled maps, each showing a different aspect of the landscape. For example, the "Water" map is displayed at the right. If you explore the maps in the order presented, you will find yourself beginning with broad, landscape patterns in Maps 1 and 2, then zooming in to see increasing detail. A user is not obligated to view the information as compiled, however. Just as with the "Prioritization" theme, any layer can be turned on or off to display just the information you wish to see, mixing and matching as desired. When doing this, keep in mind that layers at the bottom of the list will be covered by those listed higher on the page.
For more information about the maps presented in this theme, please see Mapping Vermont's Natural Heritage (available Summer of 2017).
Using Multiple Layers Together
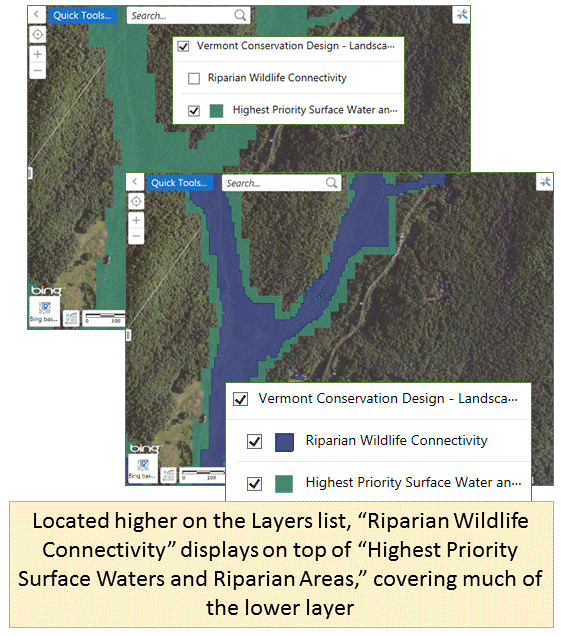
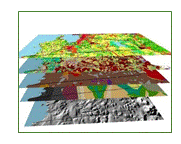
In BioFinder, many data layers can be displayed at once on your screen to show how various ecological components overlap on the landscape. Of course, displaying multiple components means that one layer must always be drawn on top of another. As a general rule, a map found higher on the Layer list is drawn on top of a layer found lower on the list. While some layers display as slightly transparent, allowing a user to see a shape underneath, you may need to turn off maps higher on the list in order to fully see layers lower on the list.

Basemaps
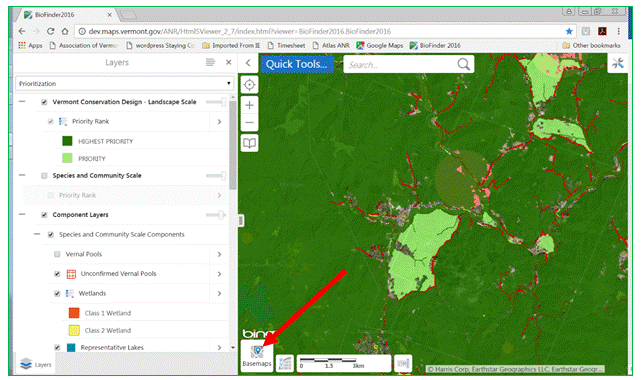
BioFinder opens with a "Bing basemap" of recent aerial photos behind the map layers. Using the base map selector pull-down menu at the bottom left of the map screen you can change the basemap to Bing topographic map, color infrareds or black white ortho (aerial) photos.
Quick Tools
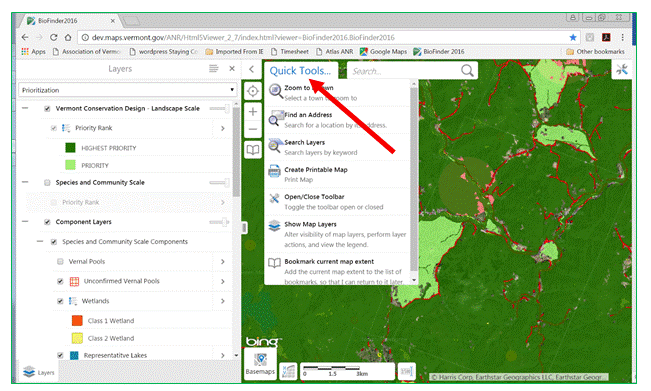
BioFinder offers a set of "Quick Tools" that lets you do certain tasks quite easily. Zooming to a particular VT town or address can be easily done here. You can also open the toolbar. NOTE: it is common that users accidentally close the Layers menu. Use Show Map Layers to turn these back on.
Tabs in the Toolbar
The toolbar at the top of the map provides access to seven tool tabs: Map Tools, Navigation, Map Data, Draw, Identify, Query, Measurement. This toolbar can be turned on/off by selecting the "Open/Close Toolbar" option in the blue, Quick Tools pull down, or by clicking the wrench/screwdriver icon in the top right corner of the map screen.

Map Tools: Instructions for using each of these tools will appear upon selection.

Share provides you with a URL of a particular place that you're zoomed in to and the specific layers that you have turned on or off. Note that your drawings or shapefiles you have added will NOT be included in the URL Export creates an image file that you can save. This option will include drawings that you've added or shapefiles you've uploaded.
Navigation: tab offers tools to help you move around the map.

Map Data: The Layer Catalog tool allows you to add other map layers from the ANR Atlasfrom the Agency of Natural Resources, or you can add GIS shapefiles of your own creation.

Draw: The tools under this tab help you customize your maps. The drawings you create (i.e. if you circle or mark an important spot) can be exported to create shapefiles (the geographically-specific files used by most mapping programs) and then uploaded back into BioFinder (using "Upload Data" under the Map Data tab). The advantage of turning your drawings into a shapefile is that you can easily turn them on and off without losing them.

Identify: Instructions for using each of these tools will appear upon selection. They can be used to extract map information for a particular area of interest.

Query: Instructions for using each of these tools will appear at the bottom of the map page upon selection. They are used to help you locate features containing particular criteria that you select.

The Landscape Report
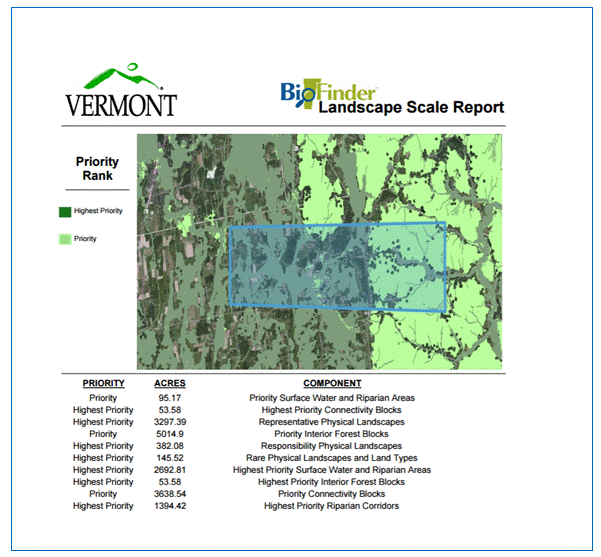
This tool generates a report (as a spreadsheet or pdf file) describing the rankings and number of acres in each tier within the area you’ve selected. In the sample Landscape Report shown below, we see an area of interest in Hinesburg and Charlotte with the following information:
- 95.17 acres is in Priority Surface Water and Riparian Areas
- 53.58 acres is in Highest Priority Connectivity Blocks
-
3,297.39 acres is in Representative Physical Landscapes
- 5,014.9 acres is in Priority Interior Forest Blocks
- 382.08 acres is in Responsibility Physical Landscapes
- 145.52 acres is in Rare Physical Landscapes and Land Types
- 2,692.81 acres is in Highest Priority Surface Water and Riparian Areas
- 53.58 acres is in Highest Priority Interior Forest Blocks
- 3,638.54 acres is in Priority Connectivity Blocks
- 1,394.42 acres is in Highest Priority Riparian Corridors
The Species and Community Report
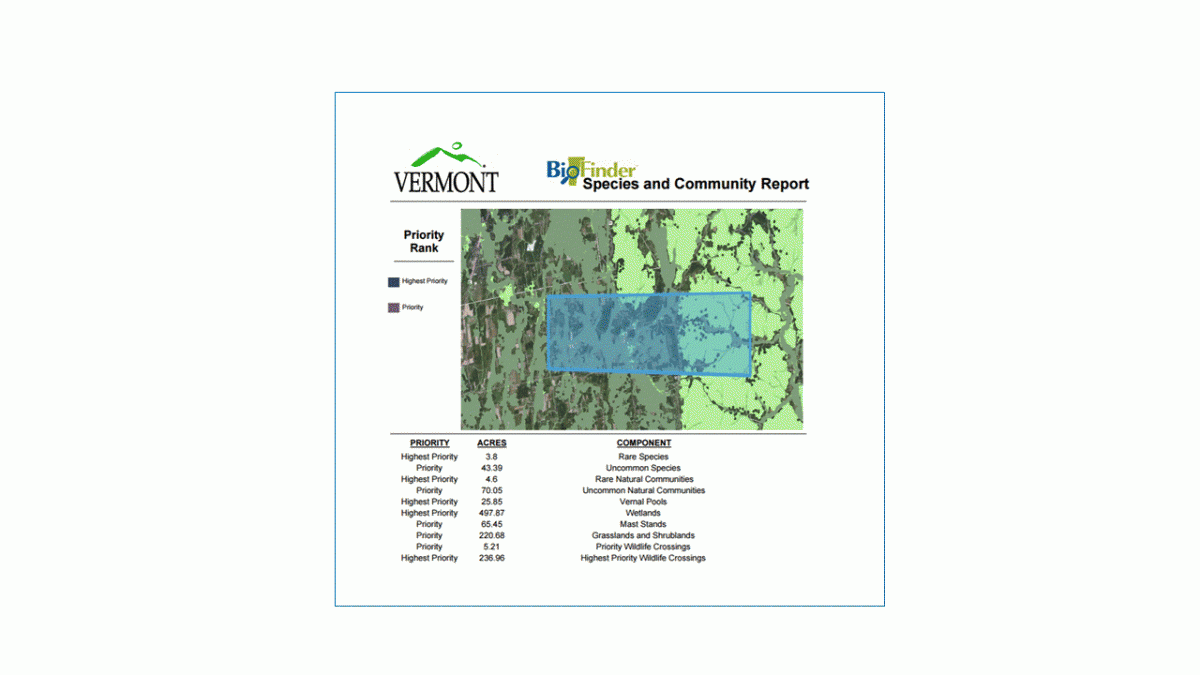
This tool generates a report (as a spreadsheet or pdf file) describing the components of biological diversity and the total number of acres for each component within the geographical area you’ve selected. It gives the size of the area (acreage) for each component. Because more than one component can overlap (for example, a habitat block can contain a wetland, several rare species, and provide habitat connectivity) the total sum of the component acreages can be larger than the total acreage of the area you’ve selected. The sample Species and Community Report shown below is the same area as above in Hinesburg and Charlotte. It identifies the presence of seven components that overlap to differing degrees.
Sample Species and Community Report
Measurement: These tools measure both distance and area on your map. Measurements are added in increments as you draw, allowing you to capture distance for each small segment that contributes to a larger distance or area.

BioFinder Definitions
Map: When we use the word "map" in BioFinder, we refer to the geographic image displayed at the right side of the screen. This map may contain just one layer or many layers.
Layer: In BioFinder, each individual dataset available to place on a map is referred to as a "layer" or "map layer." These layers can all be found in the menu at the left side of the page.
Prioritized layers: At the core of BioFinder are two layers created to identify priority locations for conservation planning efforts. These layers are Vermont Conservation Design—Landscape Scale and Species and Community Scale. In the creation of both maps, Vermont Fish and Wildlife Department biologists selected ecological components known to contribute significantly to biodiversity, assigned a priority status to each, and compiled them. The resulting layers depict locations that are conservation priorities for any of the component layers.
The phrase "prioritized layers" refers to any layer displaying priority information. This includes the two layers listed above as well as the component layers that have been categorized by ecological priority, such as "Highest priority interior forest blocks" or "Priority wildlife crossings."
Component: In BioFinder, the layers used to create the Vermont Conservation Design—Landscape Scale and Species and Community Scale prioritized layers are referred to as "components."
Scale: BioFinder categorizes ecological components into three scales: the landscape scale, the community scale, and the species scale.
In this context, the landscape scale refers to those habitats that extend across town, regional, and even state boundaries—forest networks, waterways, and physical landforms—that are the basic building blocks for ecological processes. This scale is used to capture a sense of overall ecological function of a region as a whole, without consideration for the needs of individual natural communities or species.
The community scale includes the components and process that occur between groups of plants and animals as they interact with one another and with their physical environment. For example, mast stands are described at this scale because they are associated with a particular set of physical features, plants, and wildlife that function together as a community.
The species scale refers to those habitats necessary for the survival of specific fish, wildlife, and plants. For example, wildlife crossings are locations where bear, bobcat, fisher, and a few other wide-ranging species are most likely to cross roads as they travel to meet daily or seasonal dietary needs, disperse to find mates, or fulfill other requirements. While they tend to be small in size, species-scale components are essential for maintaining biodiversity by supporting species with a known conservation need in the state or region.
In the prioritized layers created by VFWD, the Community and Species scales are generally combined.


